Pushover Analysis - Bridge Piers#
The SSD task ![]() Pushover Analysis - Bridge Piers enables the assessment of the seismic behavior of bridge piers through a pushover analysis procedure.
This involves gradually increasing a predefined load pattern to meet a specified structural demand.
The nonlinear structural response and structural energy disspipation capabilities are represented by activating the nonlinear behaviour
of correspondingly modeled concrete plastic hinges (cf. Concrete Plastic Hinge).
Pushover Analysis - Bridge Piers enables the assessment of the seismic behavior of bridge piers through a pushover analysis procedure.
This involves gradually increasing a predefined load pattern to meet a specified structural demand.
The nonlinear structural response and structural energy disspipation capabilities are represented by activating the nonlinear behaviour
of correspondingly modeled concrete plastic hinges (cf. Concrete Plastic Hinge).
Note
The concentrated plasticity models, i.e. concrete plastic hinge worklaws need to be previously assigned to the ends of the bridge columns as implicit hinges.
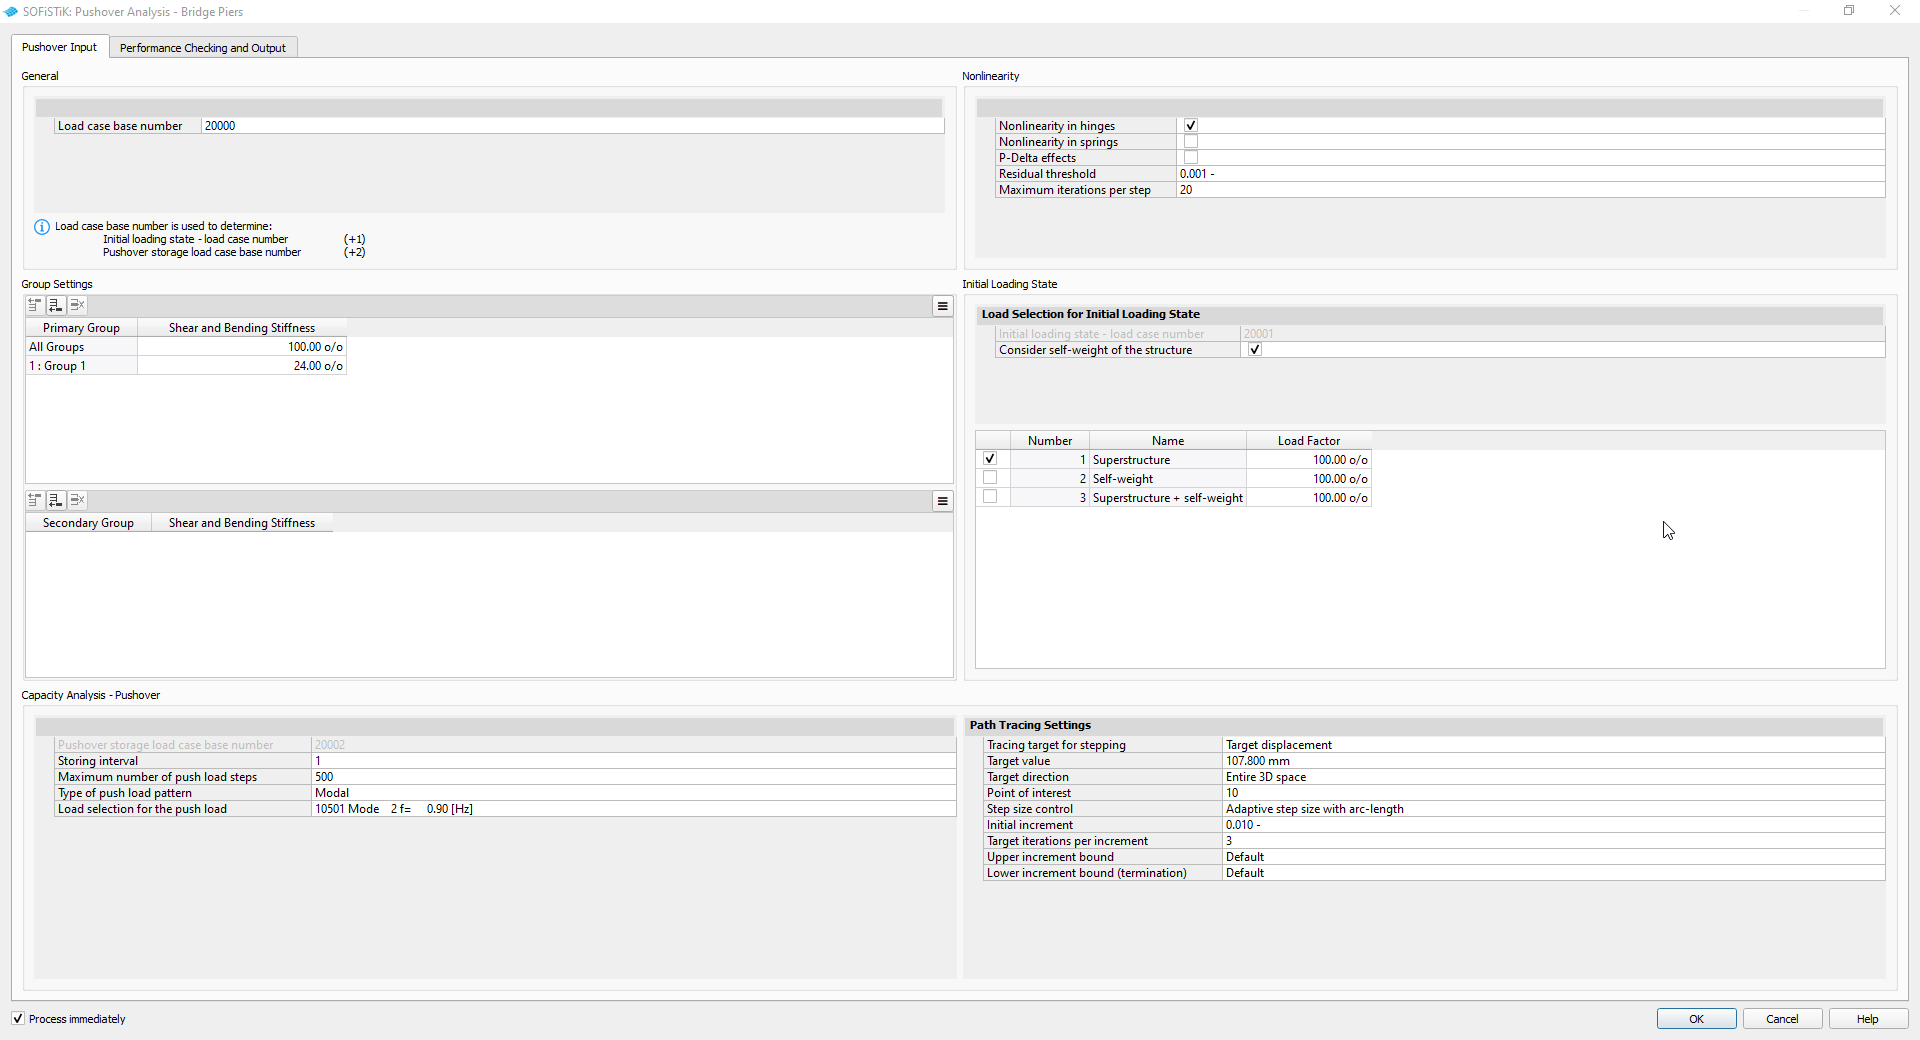
Pushover Analysis - Bridge Piers - Pushover Input tab (click on image to enlarge)#
Pushover Input#
General#
Specify the Load case base number, which is used to determine:
Load Cases |
Result Type |
|---|---|
(+1) |
Initial load state - load case number |
(+2) |
Pushover load steps - load case base number |
Nonlinearity#
Specify the nonlinear characteristics to be considered for the pushover analyis.
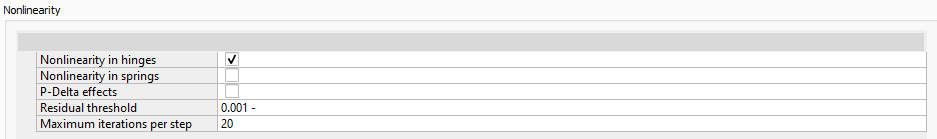
Pushover Analysis - Bridge Piers - Pushover Input tab - Nonlinearity#
Nonlinearity in hinges - Activates the nonlinear characteristics of plastic hinges (e.g., P-M-M interaction).
Nonlinearity in springs - Activates the nonlinear characteristics of spring elements (e.g., assigned spring work laws).
P-Delta effects - Activates geometrical nonlinearity (equilibrium is imposed with respect to the deformed system configuration).
Residual threshold - Maximum tolerable amount of residual forces in the system related to the applied forces.
Maximum iterations per step - Maximum number of corrections (= equilibrium iterations) within one load step.
Group Settings#
Adjust shear and bending stiffness globally or individually by group.
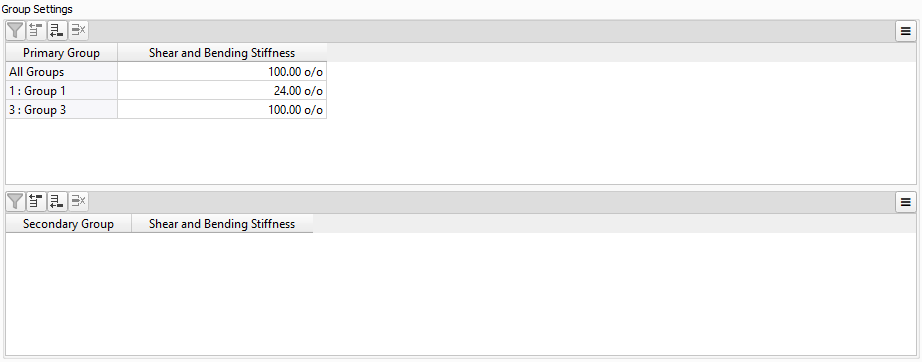
Pushover Analysis - Bridge Piers - Pushover Input Tab - Group Settings#
Note
Primary groups
Each finite element belongs to exactly one primary group. Therefore, the order of the primary group control statements is not relevant because conflicting settings cannot be made. Individual group settings override the All Groups setting.
Secondary groups
Additionally, structural elements can belong to multiple secondary groups. Therefore, the group settings are interpreted from top to bottom, meaning that the bottom-most setting overrides earlier ones, including primary group settings.
It is possible to leave cells empty in the secondary groups table, thus leaving the properties unchanged from the settings made in the primary group table.
Initial Loading State#
Specify the loading conditions preceeding the pushover analysis, i.e. define the initial loading state. The corresponding table allows for the selection of available linear load cases which may be scaled with a user-specified load factor. Optionally, self-weight of the structure may be taken into account by activating the corresponding check-box option.
Results of the nonlinear analysis of the initial loading state are be stored at the designated load case number, i.e., the Initial loading state - load case number.
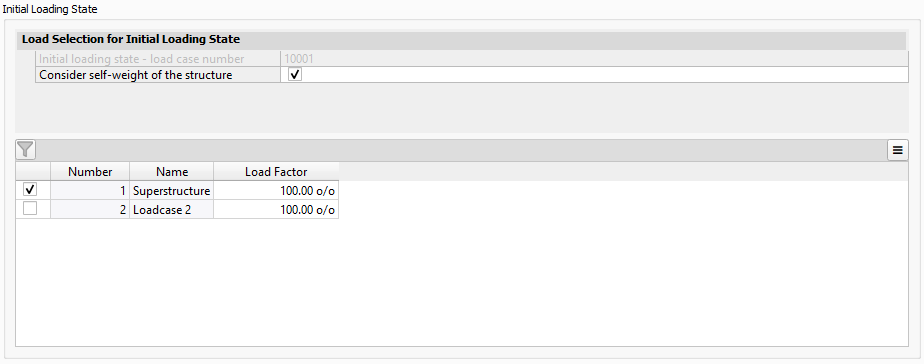
Pushover Analysis - Bridge Piers - Pushover Input Tab - Initial Loading State#
Capacity Analysis - Pushover#
Control the characteristics of the incremental pushover analysis to determine the bridge pier’s capacity to reach a designated target value. Structural behaviour during the load stepping simulation is monitored at a designated point of the structure - also termed as point of interest.
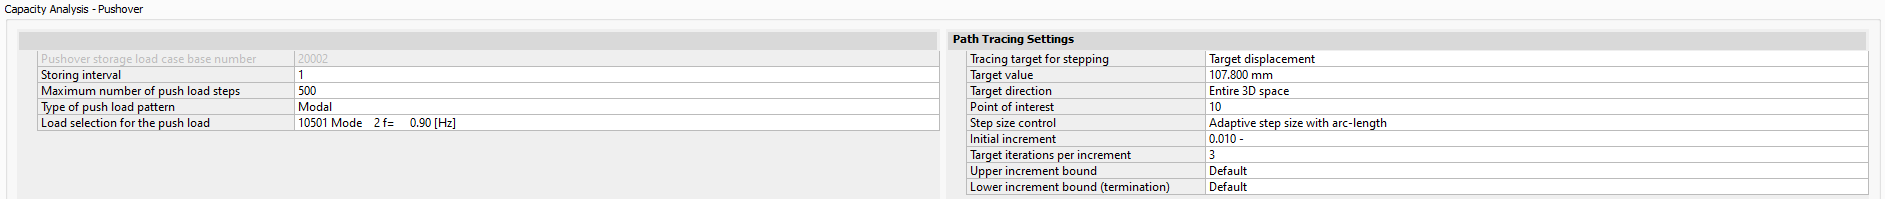
Pushover Analysis - Bridge Piers - Pushover Input tab - Capacity Analysis - Pushover (click on image to enlarge)#
Pushover storage load case base number - Starting load case number for the stepping sequence generated by the pushover analysis.
Maximum number of push load steps - Determines the maximum number of load steps, which the solver is allowed to perform during the pushover analysis. Additionally, the calculation terminates, if the target value is reached before that or if convergence issues arise.
Storing interval - Speficies which step of the stepping sequence is to be stored. If for example a value of 2 is set, results of every second load step are stored. The final step is always stored.
Type of push load pattern - Both modal and user-defined push load patterns are supported. Modal loads are only applicable when dynamic eigenmodes have been previously calculated. Additionally, any linear load case that is assigned to an action can be chosen as a user-defined load.
Load selection for the push load - Selection of the concrete load case that represents the push load. Selection is restricted to load cases that obey the chosen Type of push load pattern.
Path Tracing Settings#
Define the settings for the path tracing procedure, i.e., the incremental-iterative method which is used to attain structural equilibrium for imposed loading and nonlinear structural response.
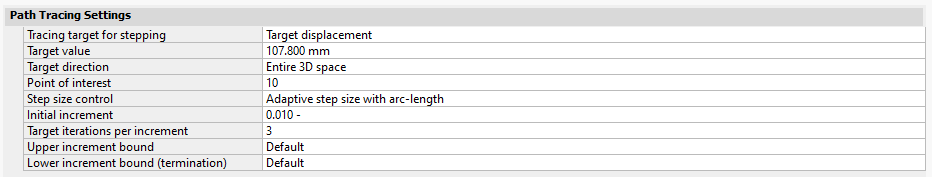
Pushover Analysis - Bridge Piers - Pushover Input tab - Path Tracing Settings#
Tracing target for stepping - Type of target criterion for the stepping procedure (= termination criterion).
Target value - Threshold for the minimum displacement to be reached before solution termination.
Target direction - Direction(s) relevant for the evaluation of the target displacement. Possible options are the global x-,y- and z-directions as well as the entire 3 space. In the latter case the vector length of the displacement components is used.
Point of interest - The point, at which structural deformation (vector length of the three-dimensional displacement components) is monitored, when the criterion for termination is checked. In Automatic mode, the node which exhibits the most pronounced deformation is selected for monitoring. Its node number is stored to CDB and is accessible via the variable #PUSH_POI.
Step size control - The Constant step size and Adaptive step size controls are based on a simple load stepping procedure which monotonically increases the load. Hence, these options are not suitable for stepping on a plateau or a descending branch. For these cases the Adaptive step size with arc-lengh step control is mandatory. If adaptivity is used, the load increment size is recomputed at the beginning of each new step aiming at convergence of the respective load steps within the targeted number of iterations per increment. If the previous step diverged, an increment reduction is applied.
Initial increment - The size of the load increment in the very first step. In case of constant step size control, this is the increment size of each step throughout the entire solution.
Target iterations per increment - Number of desired iterations per load step, see step size adaptivity.
Upper increment bound - The maximum increment size if step size adaptivity is activated.
Lower increment bound (termination) - The allowed minimum increment size in case of increment reduction. Once it is reached, continued processing of the problem is regarded infeasible. In this case, the solution procedure terminates.
Performance Checking and Output#
Performance Evaluation#
Assess the performance of a bridge pier by generating a pushover curve. This curve is derived from the incremental pushover analysis by considering the structure’s base shear and the displacements at the point of interest.
Note
For more information about the pushover curves please see the SOFiLOAD manual - PUSH record.
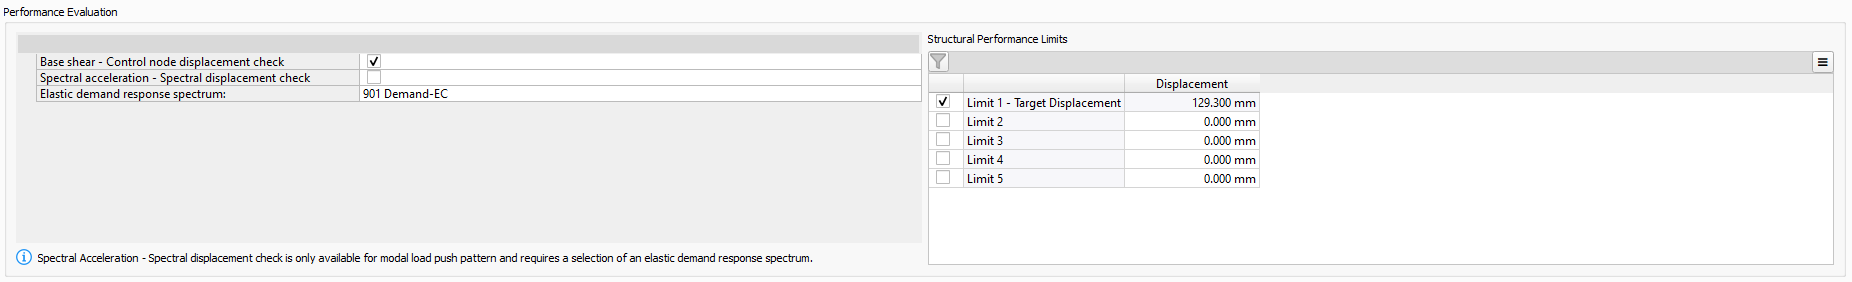
Pushover Analysis - Bridge Piers - Performance Checking and Output Tab - Performance Evaluation (click on image to enlarge)#
Base shear - Control node displacement check - Generate a pushover curve of the base shear as a function of the displacement at the Point of interest.
Spectral acceleration - Spectral displacement check - Generate a capacity diagram by converting the base shear - control node displacement curve into the SDOF system, spectral acceleration-spectral displacement coordinate system. Additionally, the capacity diagram is plotted against the elastic demand diagram, which is generated by converting the chosen elastic response spectrum from the spectral acceleration - period format to the spectral acceleration - spectral displacement format.
Elastic demand response spectrum - Select a response spectrum to generate the elastic demand diagram for the Spectral acceleration - Spectral displacement check.
Note
Spectral Acceleration - Spectral displacement check is only available for modal load push pattern and requires a selection of an elastic demand response spectrum.
Structural Performance Limits - Define displacements of interest, which will be depicted as vertical lines (limits) alongside the generated pushover curve. The first structural performance limit is reserved for the target displacement, which is specified on the Pushover Input Tab.
ECHO Options#
Select the extent of the generated report for the Initial Loading State and Capacity Analysis - Pushover.
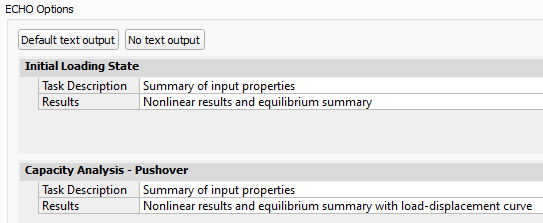
Pushover Analysis - Bridge Piers - Performance Checking and Output- ECHO Options#