GRAPHIC#
Note
In Version 2020, the new name of WINGRAF is GRAPHIC.
Basic Workflow#
Important
This is a general description, which can be different from the project discussed in specific tutorial. Please make the necessary adjustments by yourself.
The module GRAPHIC plots a visualization of results. It is designed to display all available data from the database in a graphical way. Important to know is, that GRAPHIC will save only the graphical settings. That means, any time you open a GRAPHIC file, the displayed results are a real time view from the database. GRAPHIC can be used in two mayor ways.
as a task, called “Interactive Graphics” inside SSD
as an external application
Both options will be explained in detail below.
Task “Interactive Graphics”#
To use GRAPHIC as a task “Interactive Graphics” please follow the steps listed below:
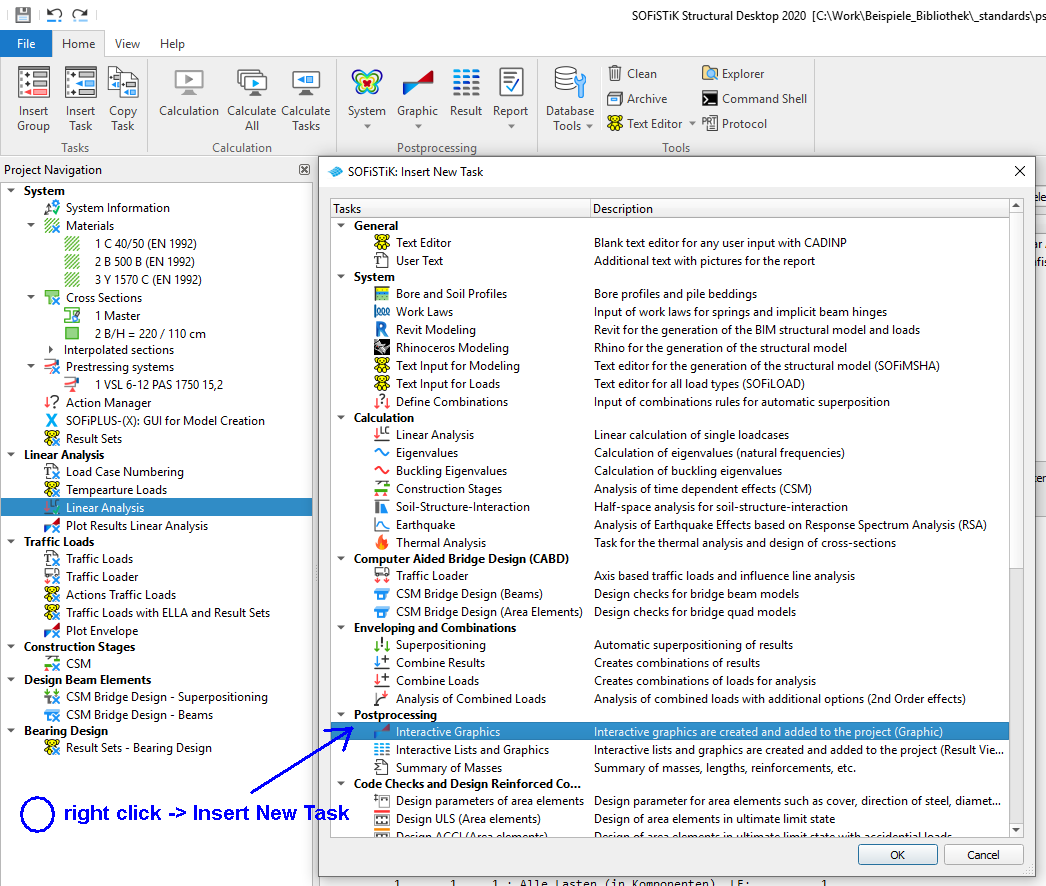
insert a new task “Interactive Graphics” into your SSD project
open task with a double click –> now GRAPHIC opens in a separate window
create new graphics
close GRAPHIC and save the changes
transfer data to the SSD project –> confirm with “Accept changes”
now the task is part of the SSD project
rename the task with right click menu “Rename”
run this task to have the graphics available inside the documentation (Report)
The following picture shows, how to create a new task “Interactive Graphic” inside the SSD project.
GRAPHIC Stand Alone#
The module GRAPHIC can also be used as an external application. Follow these steps:
open GRAPHIC from the SSD or TEDDY ribbon bar
create new graphics
save settings via menu “File > Save as”
close GRAPHIC
The following two pictures show, how start GRAPHIC from the SSD and TEDDY toolbar.

GRAPHIC in SSD ribbon bar

GRAPHIC in TEDDY ribbon bar
You may open this file any time and modify the settings.
Note
GRAPHIC only displays the data from the database. Any time you open GRAPHIC, the latest information from the database will be displayed.
Basic Principles#
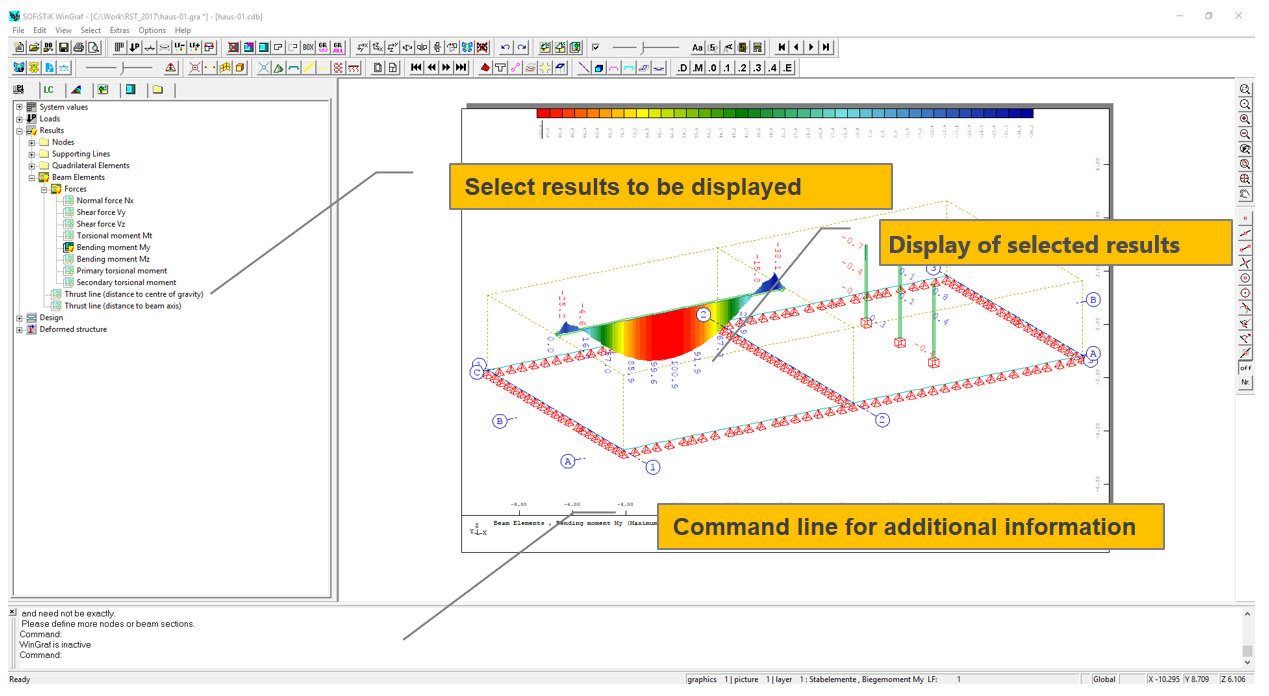
Now we introduce a few basic principles, which will help you to understand the workflow better. GRAPHIC is a separate module within the SOFiSTiK FEA package. Any time you open GRAPHIC, it will open in a new window. The main screen is divided into three parts. On the left hand side you will see a tree-view of all available data. On top of that you have several tabs. The bottom line represents a command line. Some features request an input in that line. On the main part of the screen you will see the structure including the selected results on a symbolic sheet of paper.
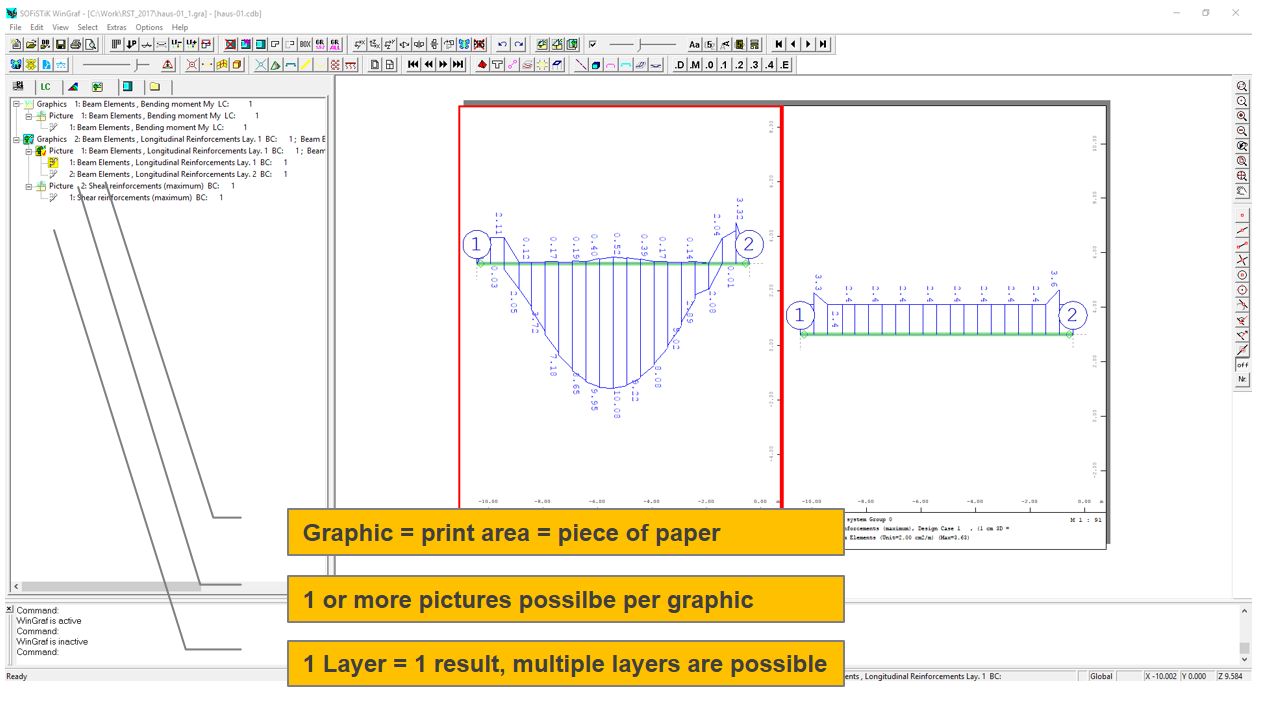
The most important thing is to understand the principal setting of GRAPHIC. It consists of three levels. The first level, the graphic itself, represents the sheet of paper you print your graphics on. The second level, the picture, represents the option how many pictures you want to display inside one graphic. The default setting is one picture per graphic. It is also possible to have more than one picture in the width and height of the graphic. The last level, the layer, represents always one result from the database. For example you need two layers to display the bottom and top reinforcement of beam elements in one picture.
Important features#
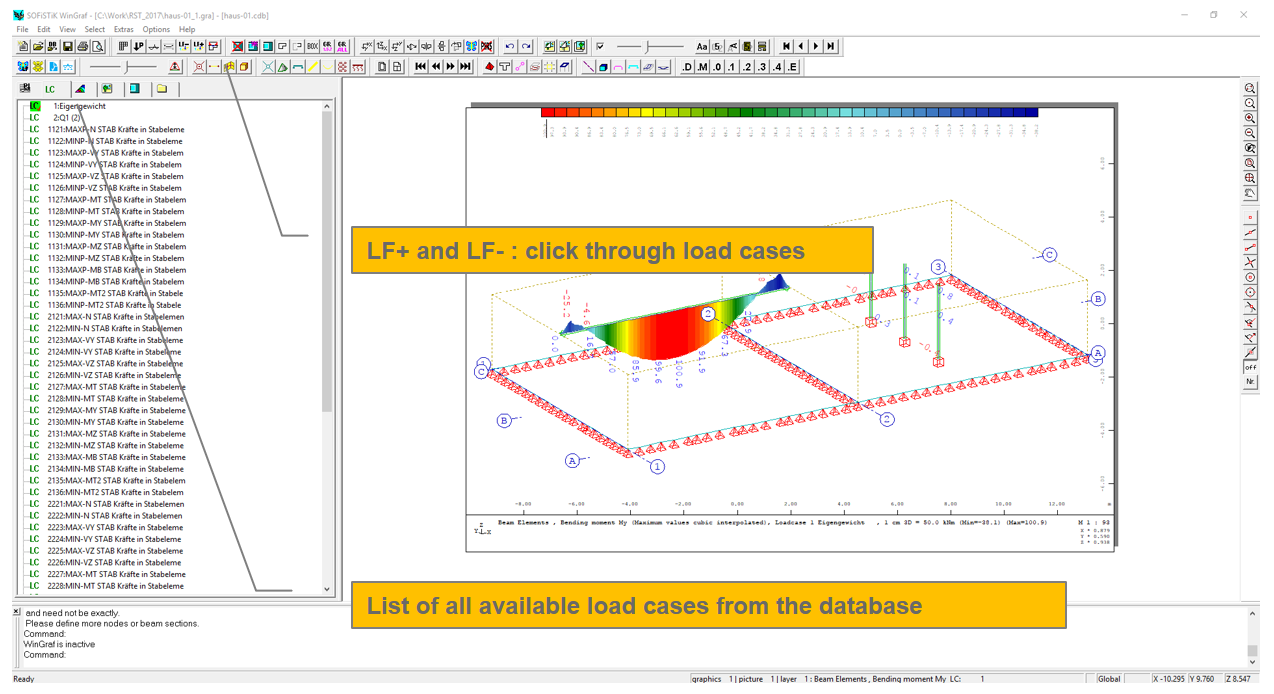
In case you want to see the results from different load cases you may click through all available load cases. Inside the tree-view on the left hand side, you will see a list of all load cases from the database.
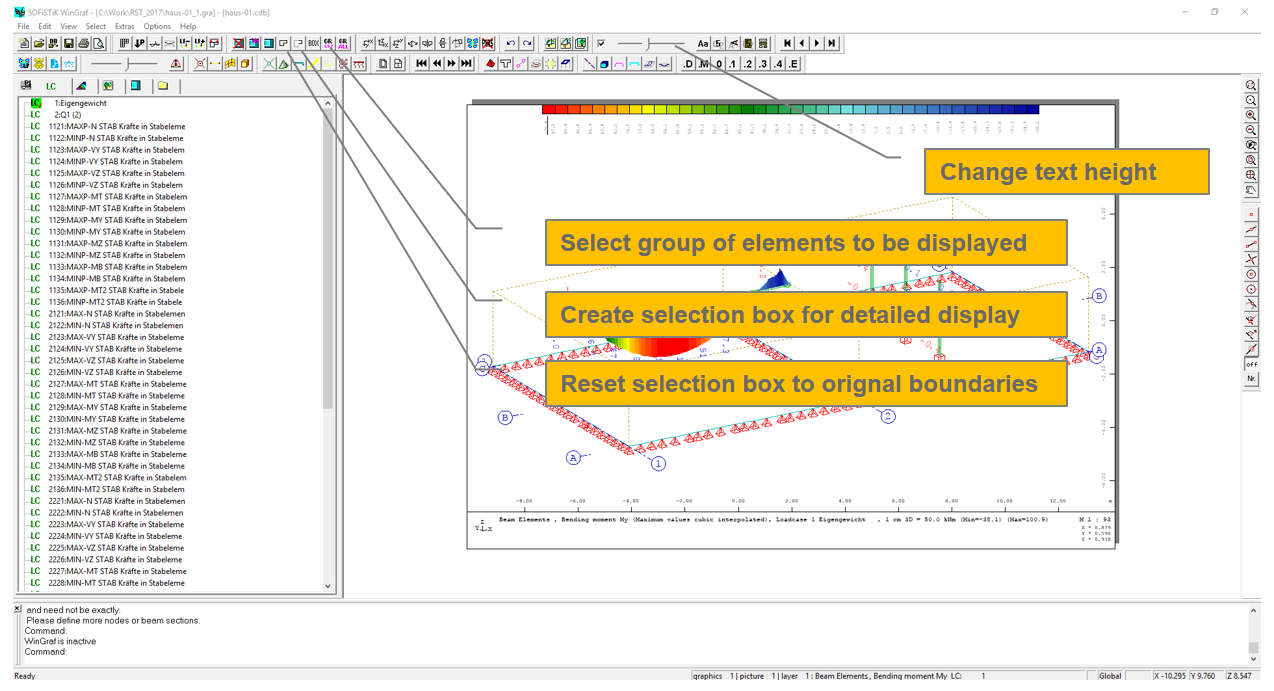
Most of the commonly used commands are listed inside the toolbar on top of the window. There is a slider to change the text height, to display only selected group of elements, to create a selection box and to display all elements again.
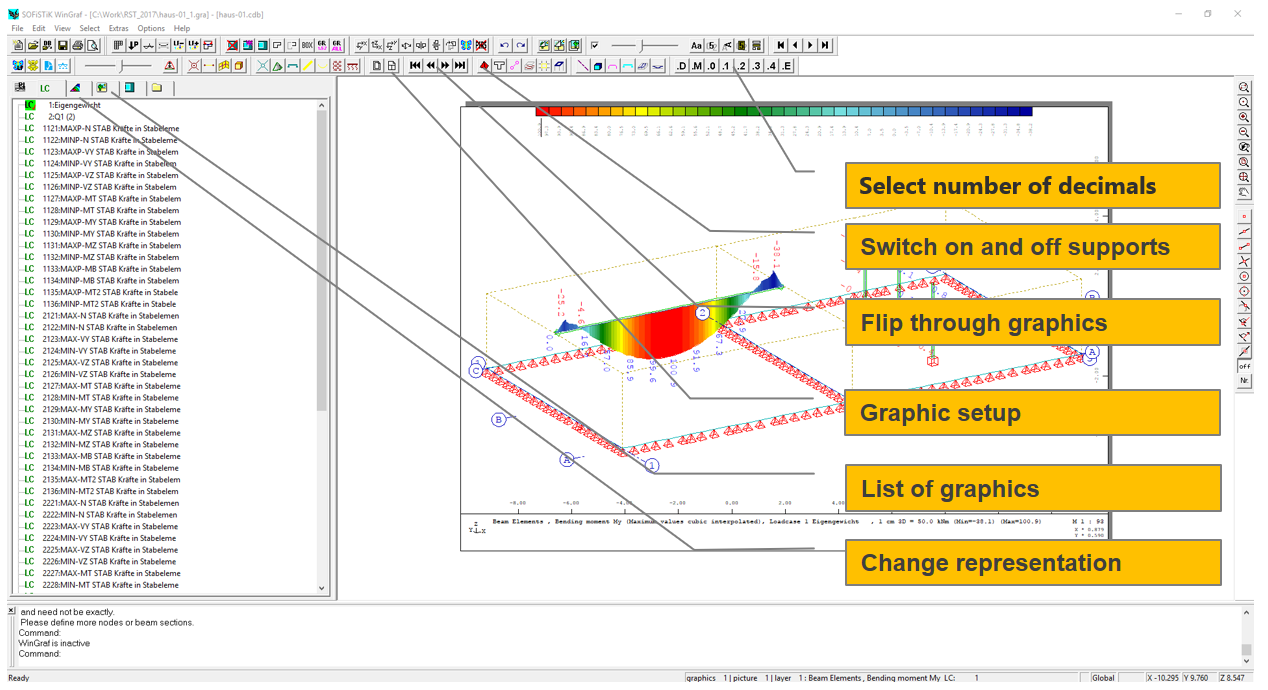
Other important commands are shown in the picture below.
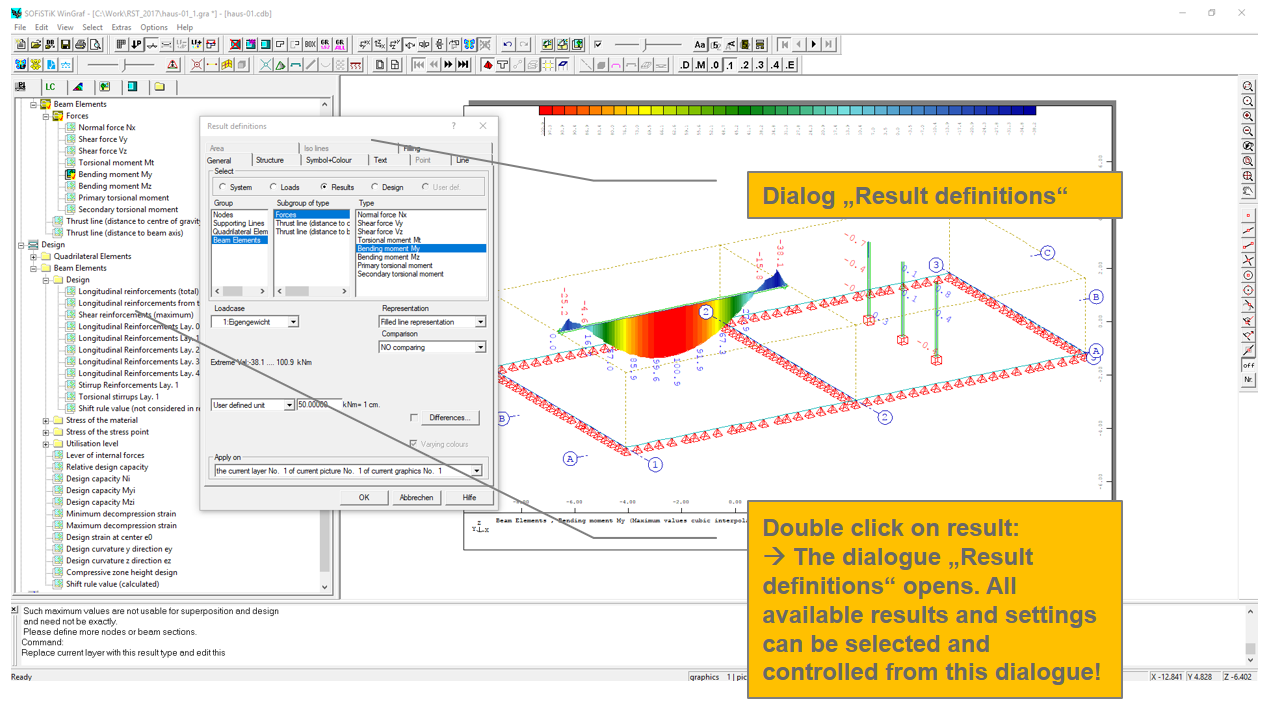
The last important feature is the “Result definitions” dialogue. This dialogue can be opened with a double click from any result selection from the tree-view on the left hand side. We recommend to use this dialogue when beginning to work with GRAPHIC. From this dialogue you will have access to all necessary settings of GRAPHIC.
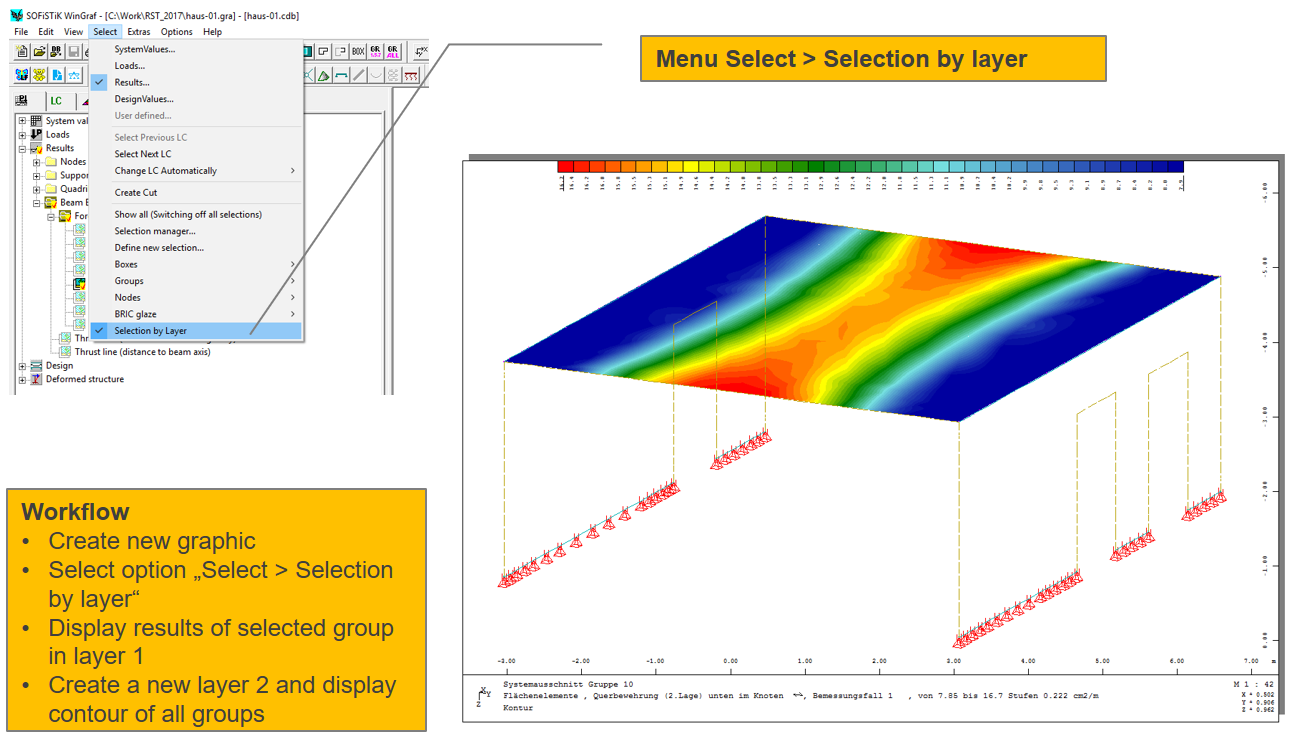
The last important feature we like to introduce here is the option to select the results layer by layer. This means, you can display the results for the selected elements only and display all elements without results in a second layer.
